
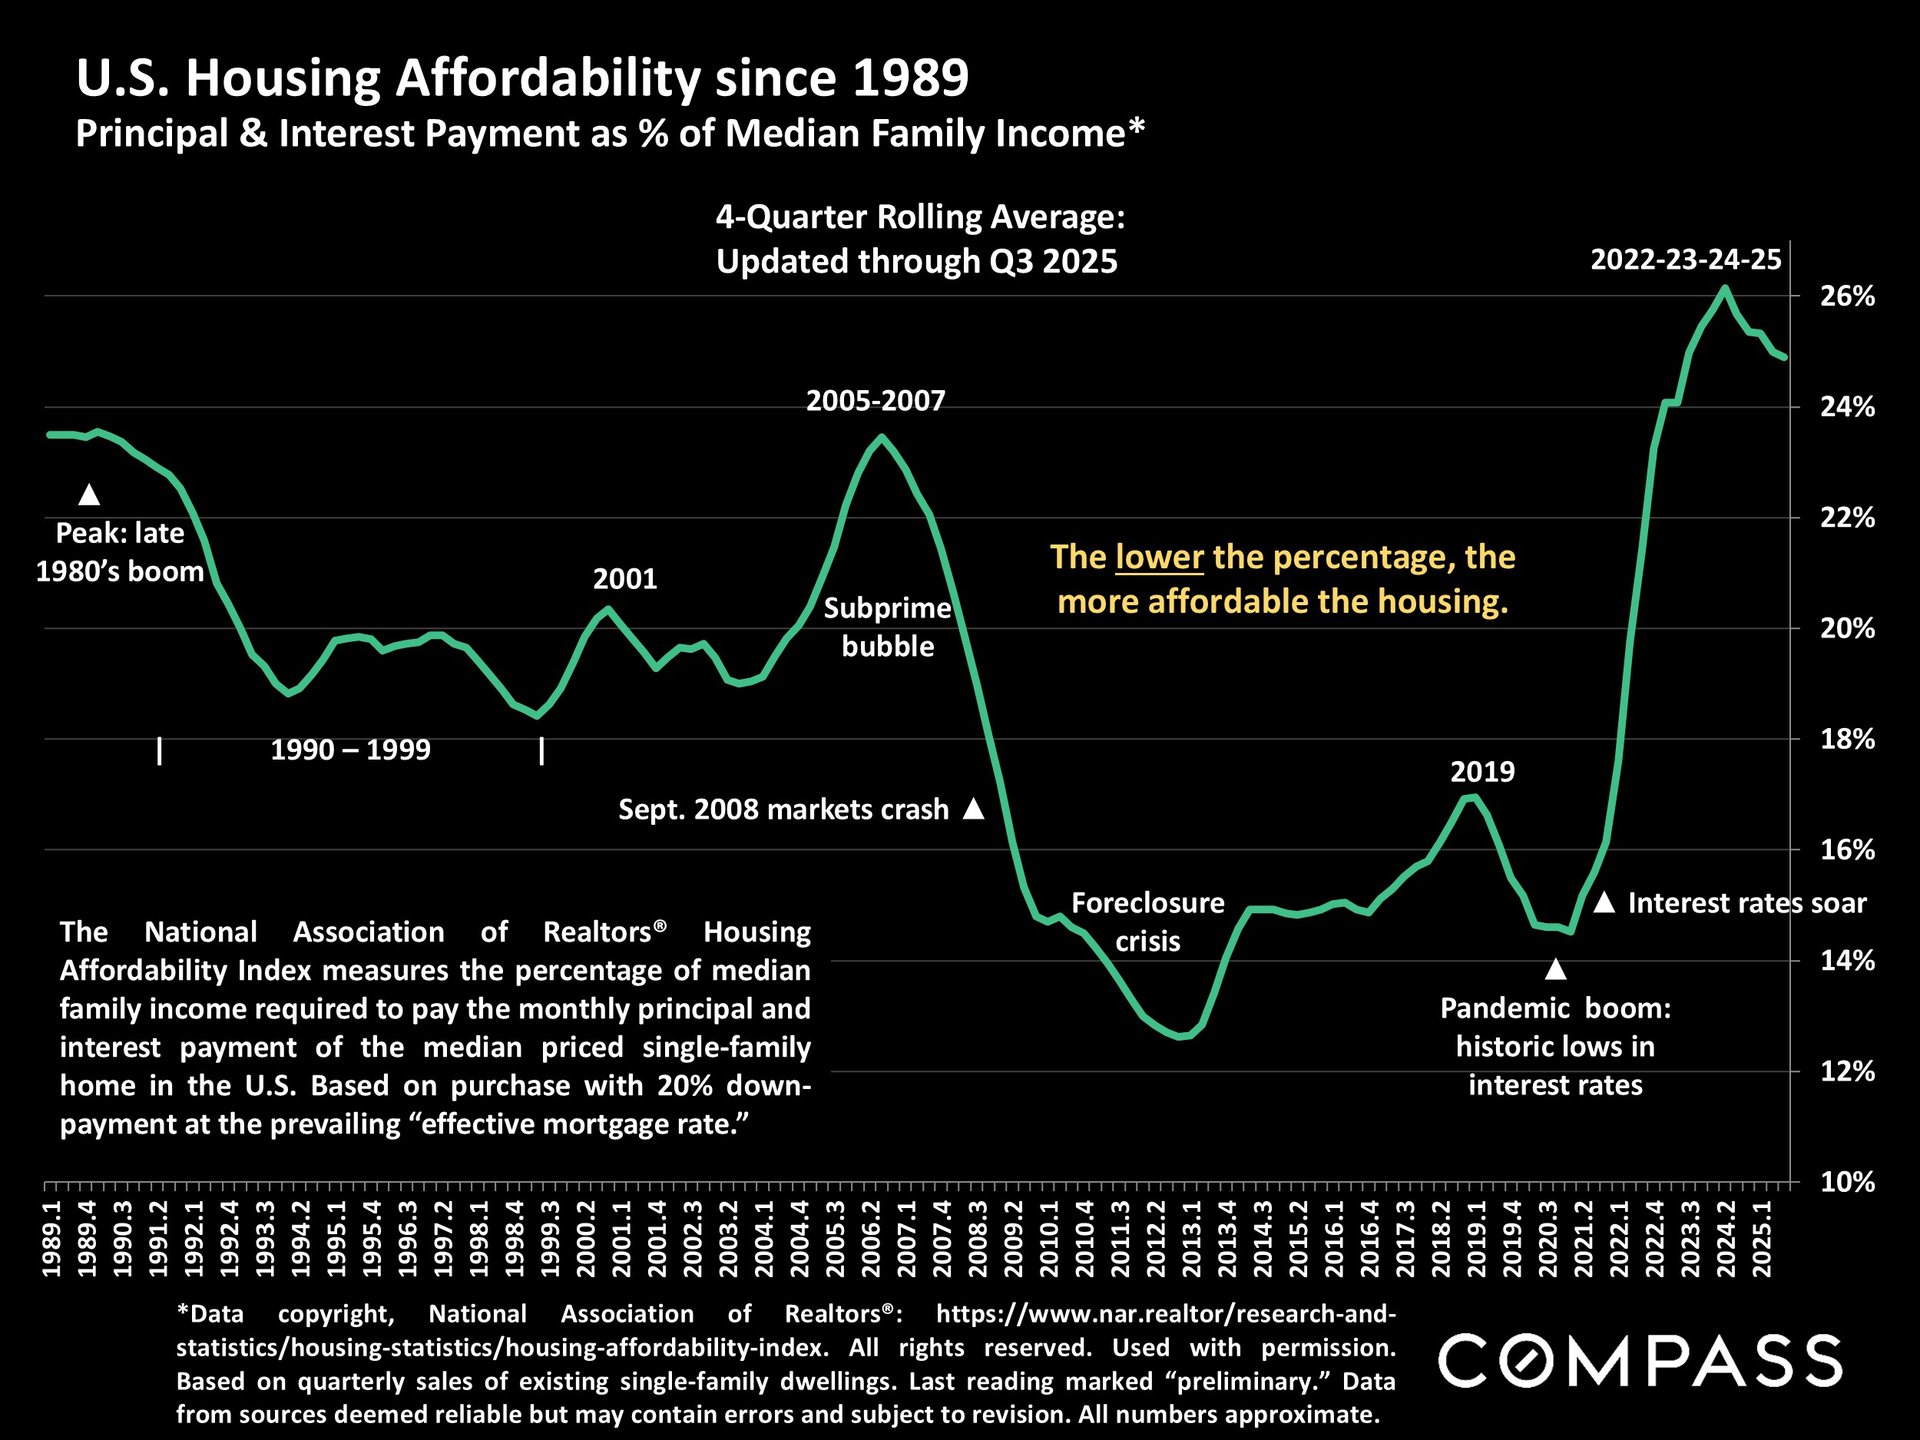
On this chart higher readings signify less affordability. Housing affordability remains a huge issue, but it has been improving with the decline in interest rates.

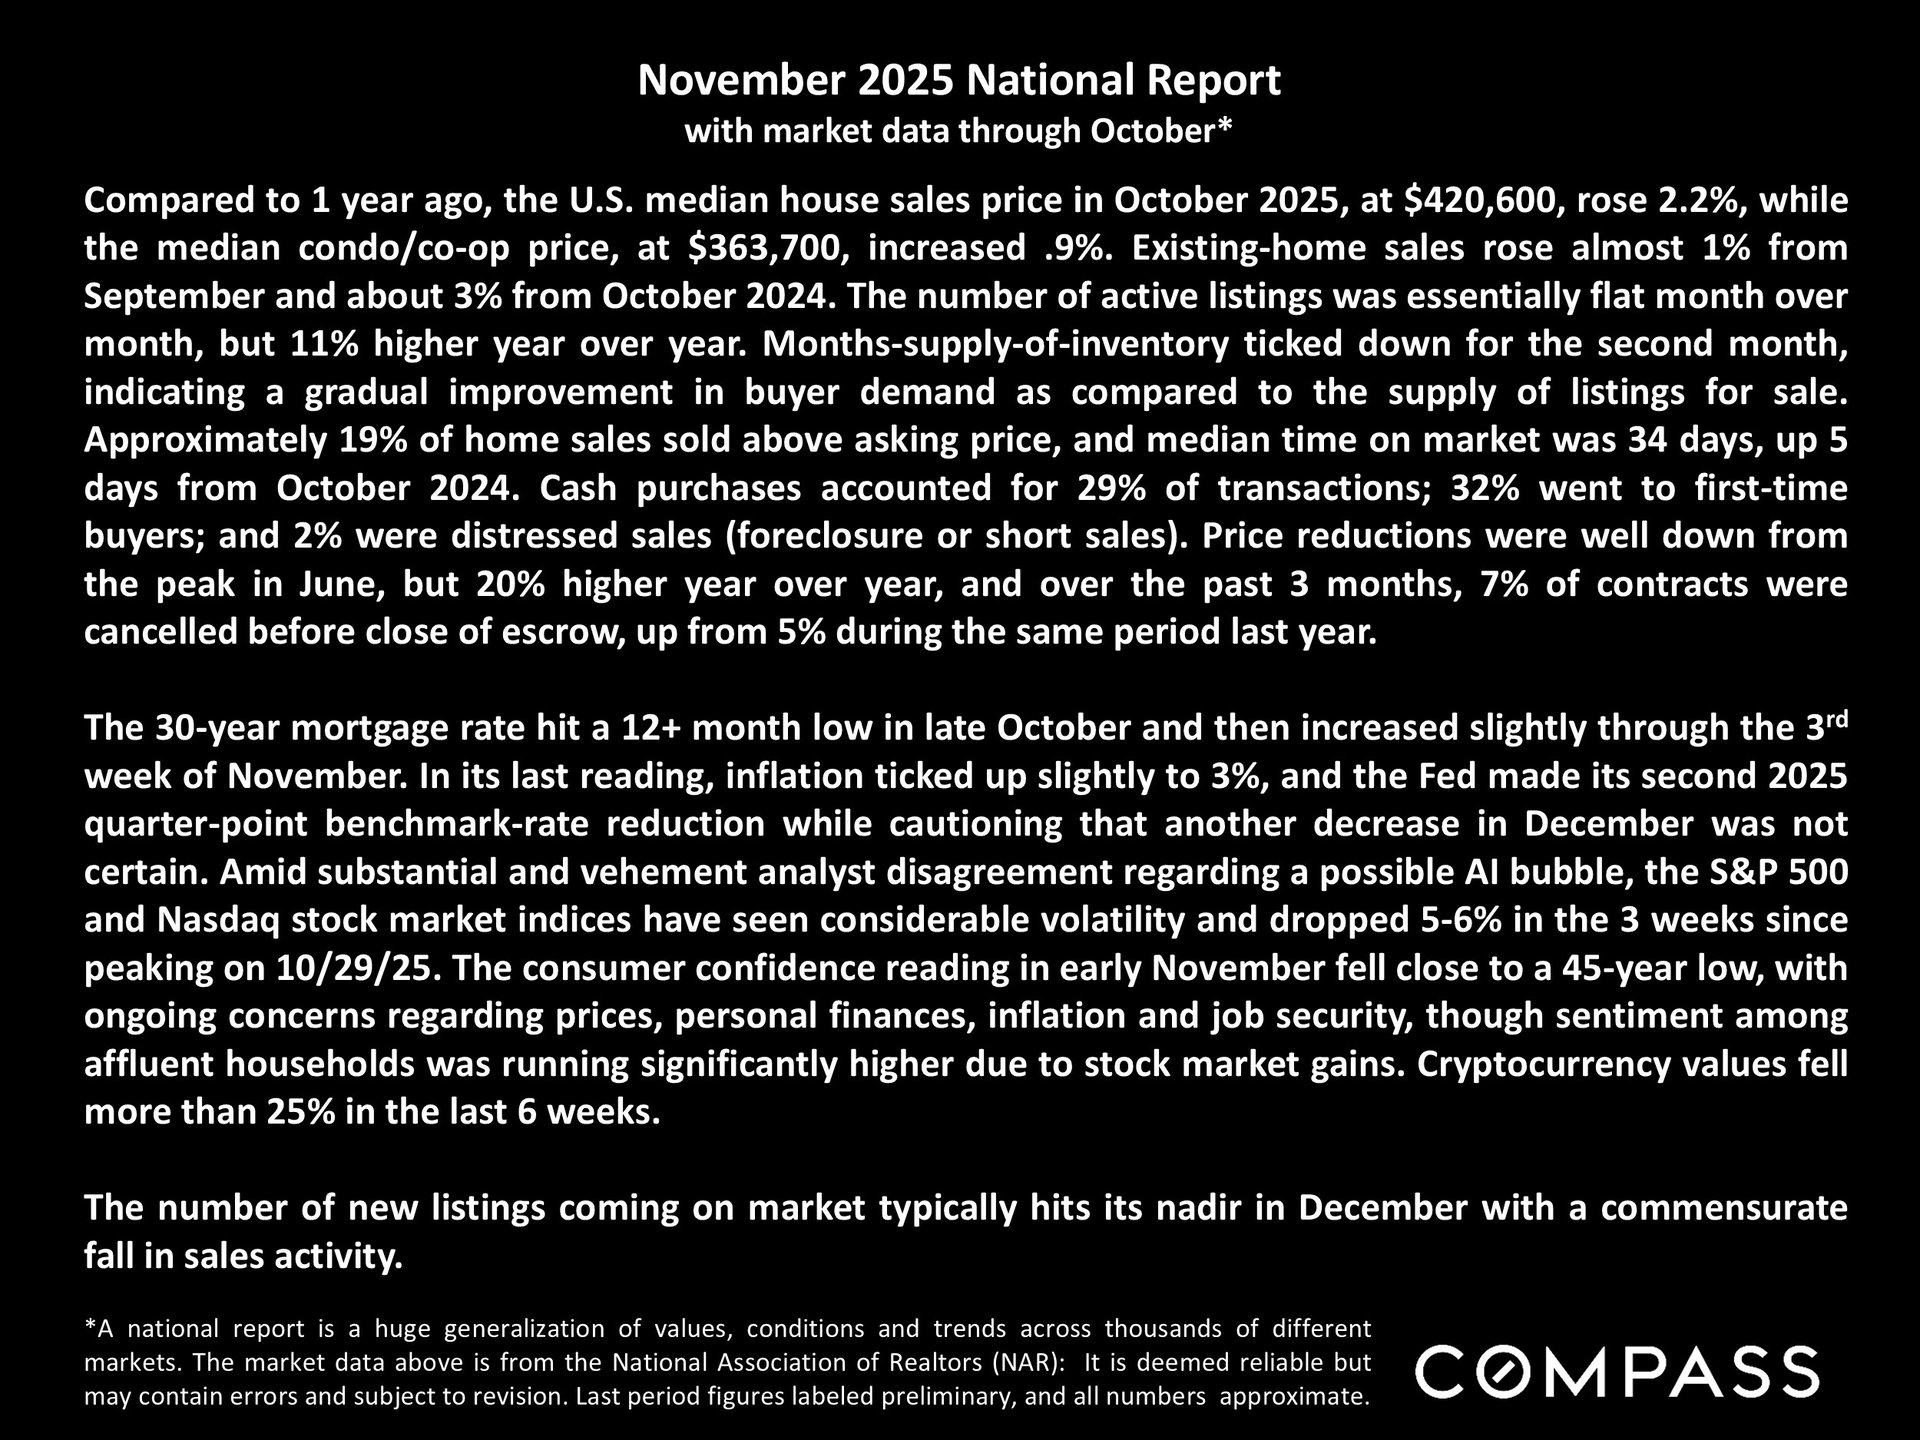
Stock markets have experienced substantial volatility since their peaks in late October.

On this chart higher readings signify less affordability. Housing affordability remains a huge issue, but it has been improving with the decline in interest rates.

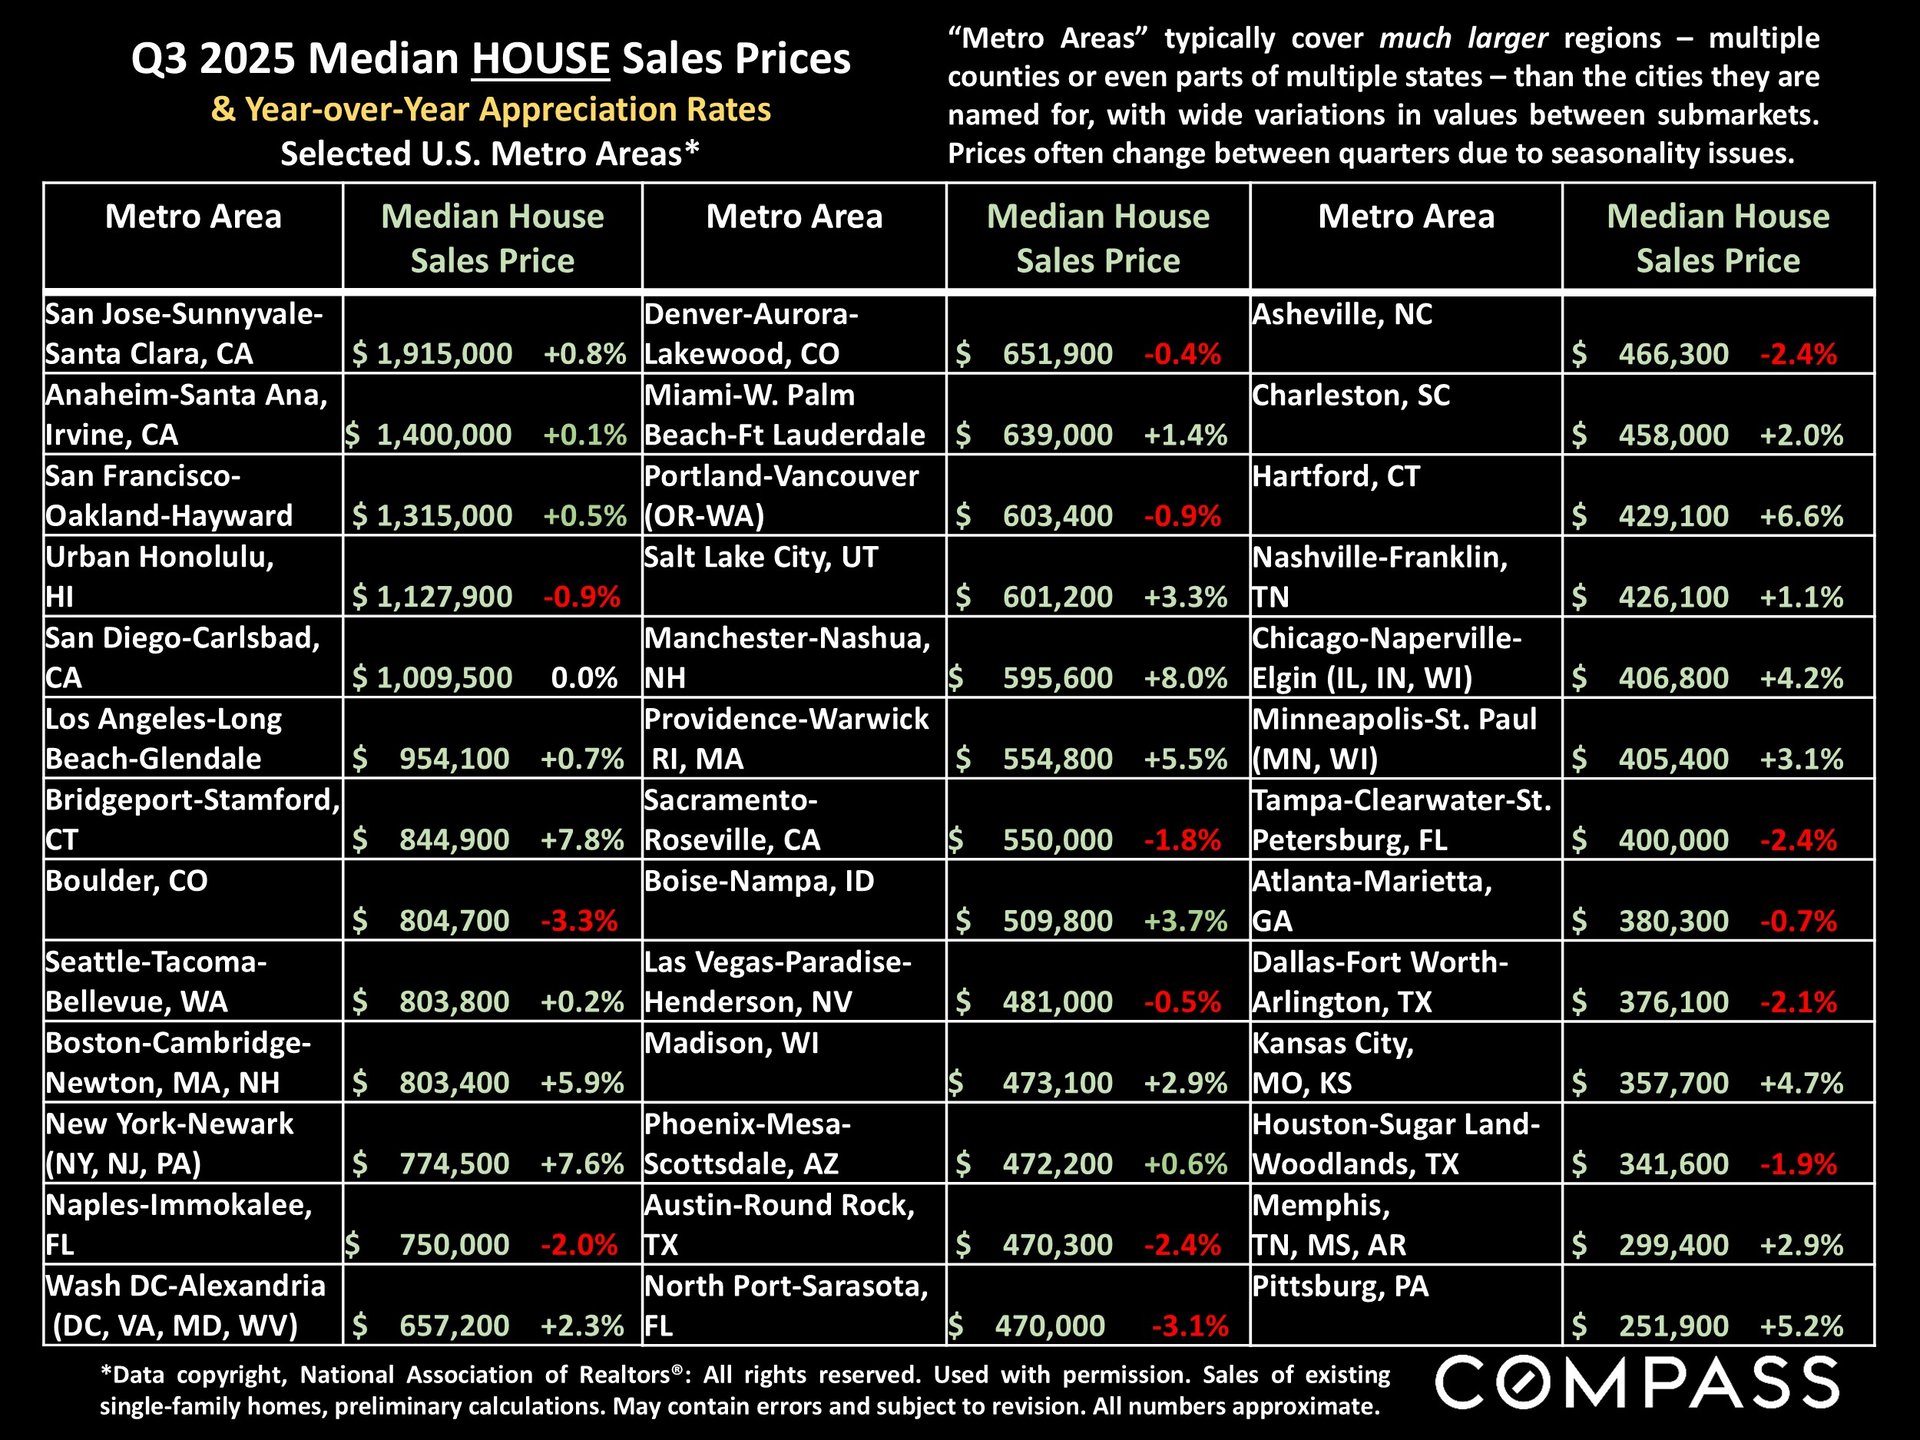
This table reviews Q3 "metro-area" median house prices, as well as year-over-year price changes. Generally speaking, northeast metros have seen the highest appreciation rates over the past year, while those in the south/southeast have been more likely to have had median price declines - but some of the metros with declines had the highest appreciation rates in the previous years.
Metro areas typically cover multi-county regions containing a wide range of very different submarkets.
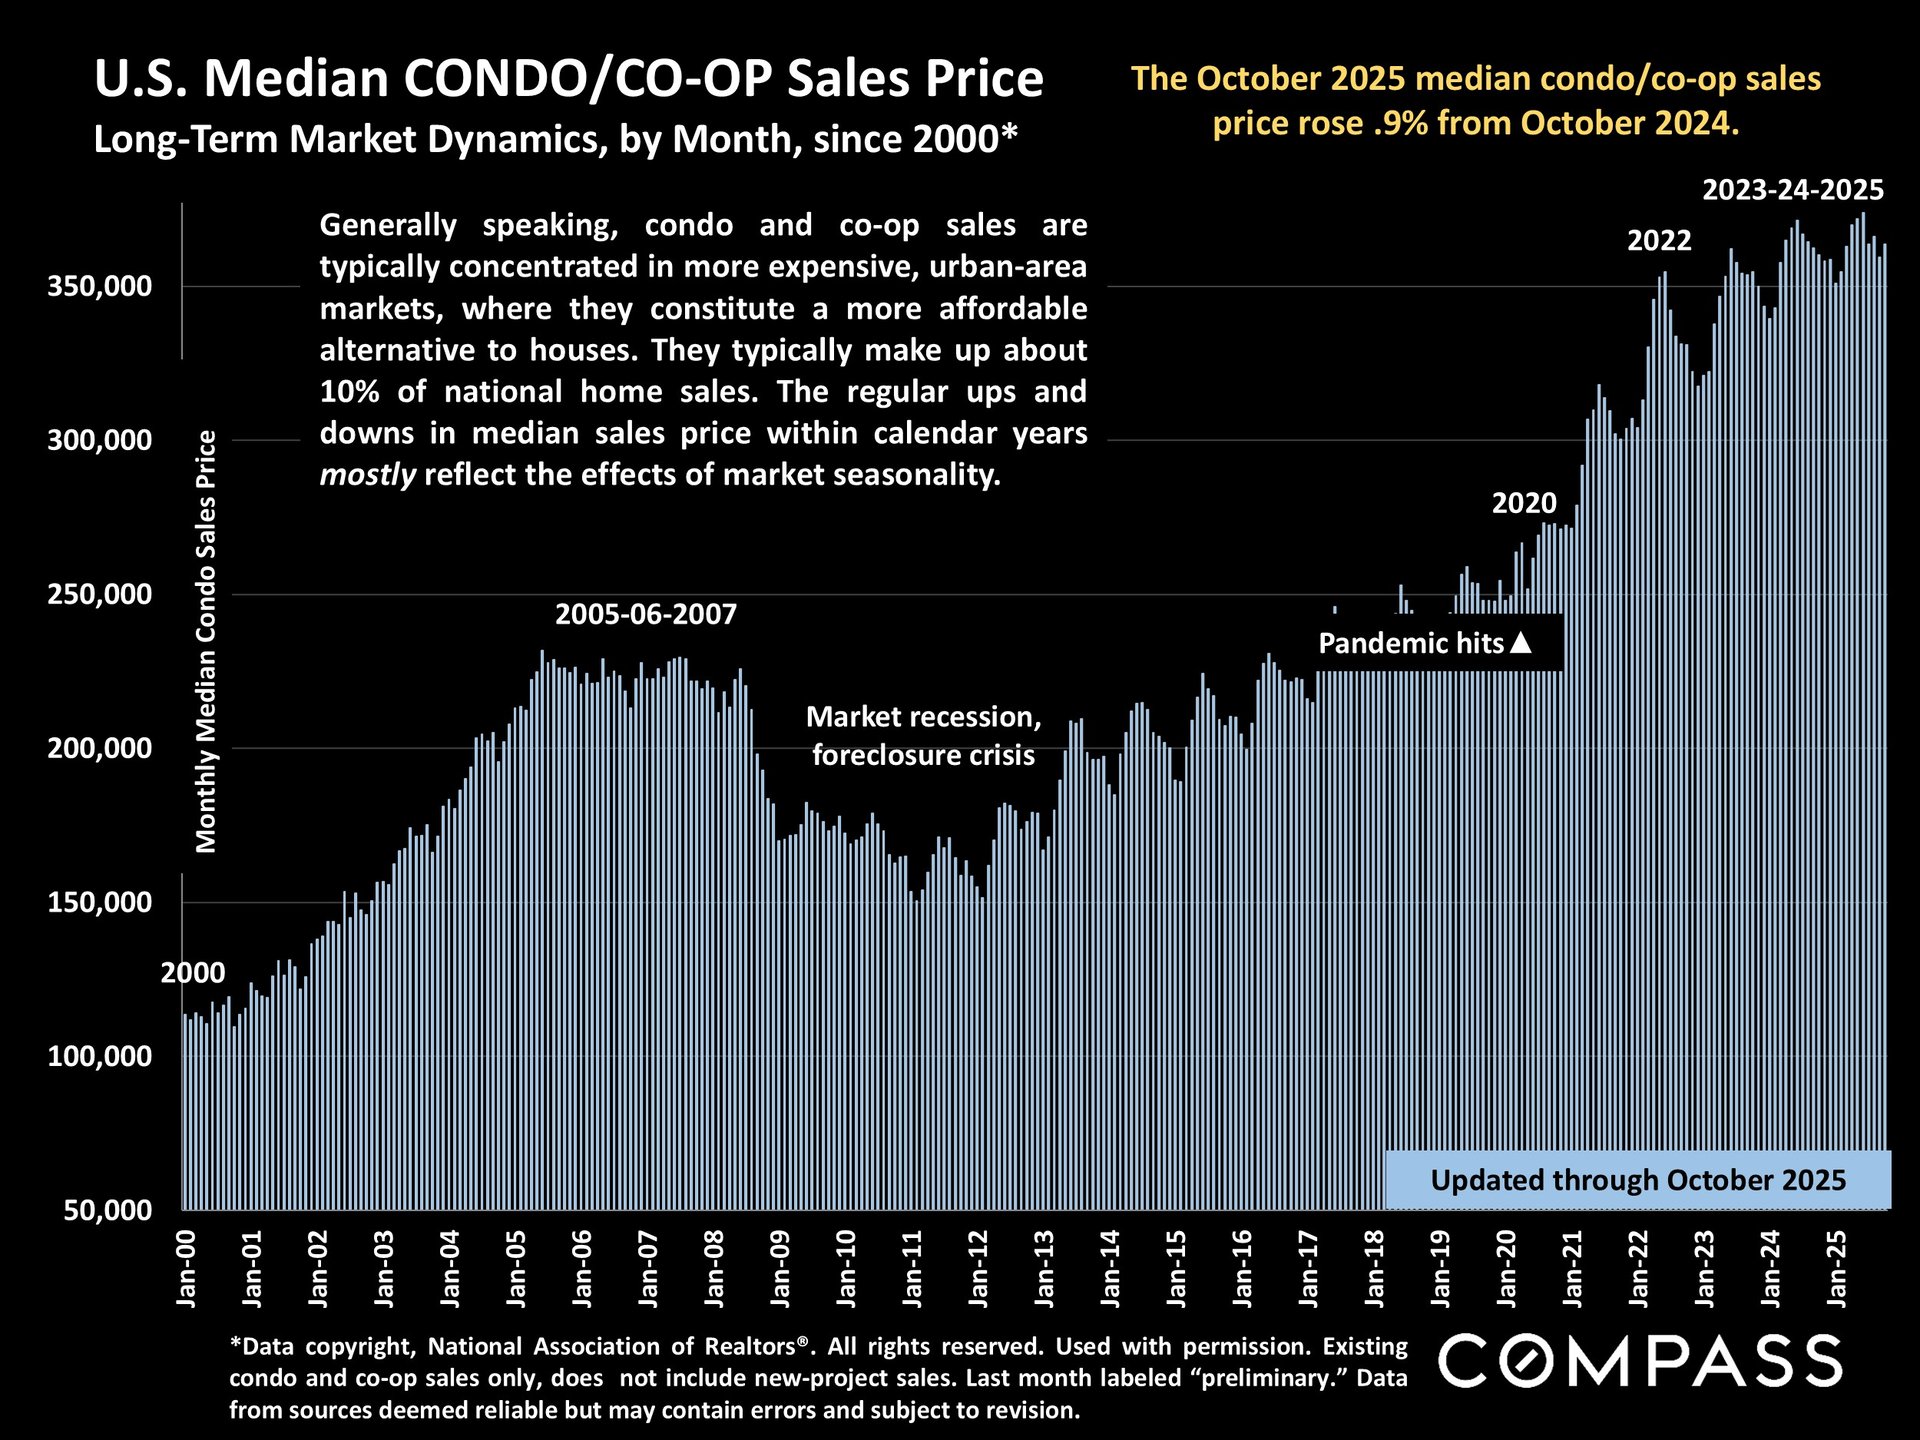
Metro-area median condo/co-op sales prices: Condos and co-ops have been more likely to see year-over-year price declines, though northeast metros have commonly bucked that trend.

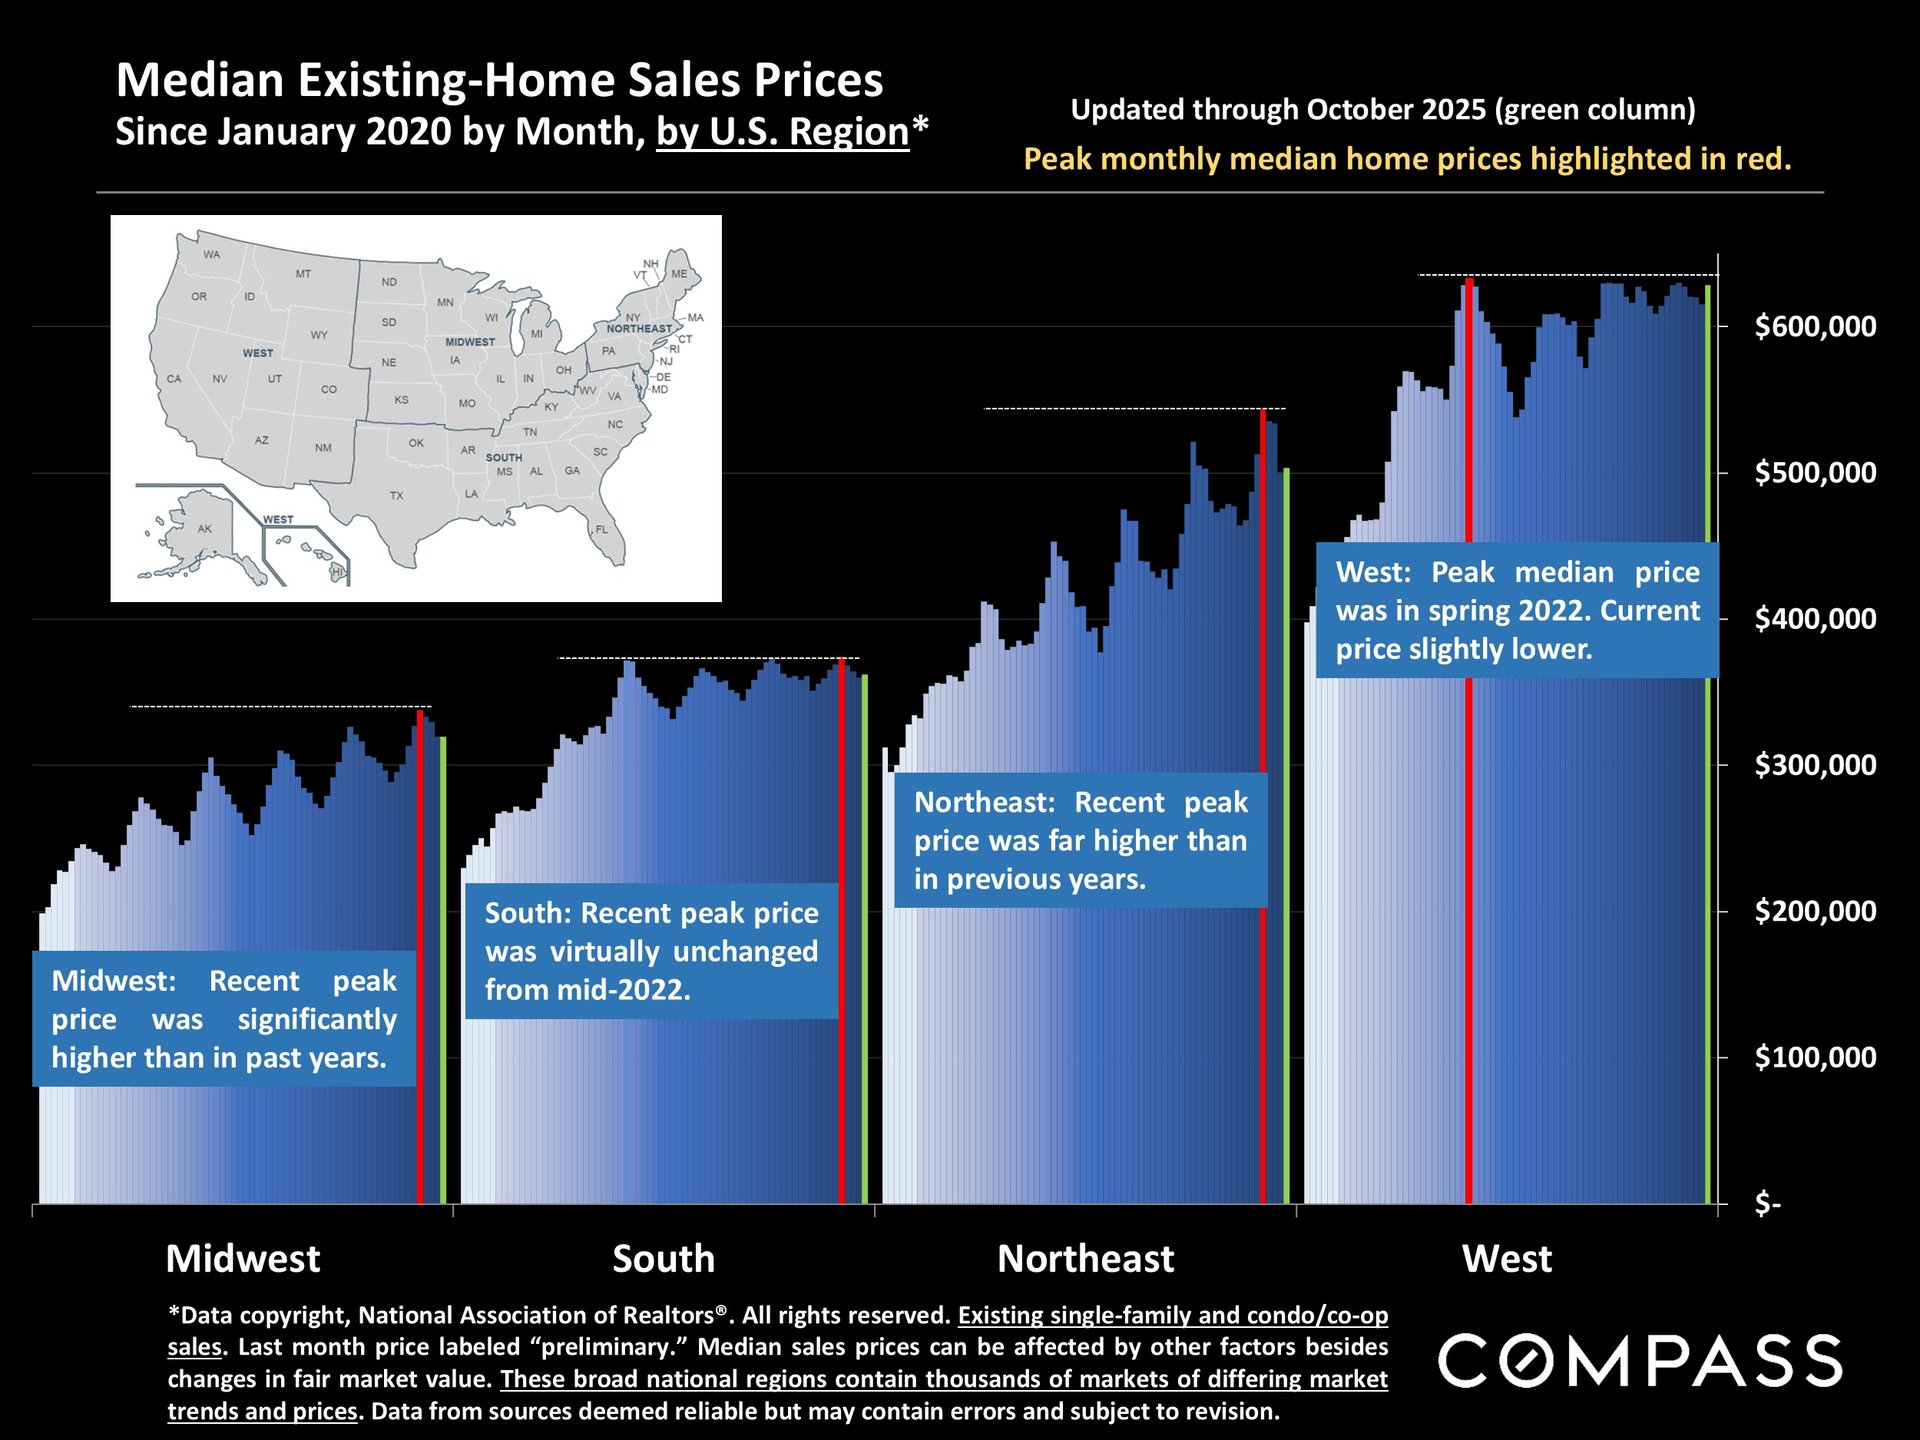
The National Association of Realtors divides the country into 4 very broad regions. The chart below reviews monthly median home prices - for house and condo/co-op sales combined - since January 2020. The red columns identify the month each region hit its all-time peak price during the last 6 years, and the green columns reflect prices in October 2025. The regular ups and downs mostly reflect the effects of market seasonality on home prices.
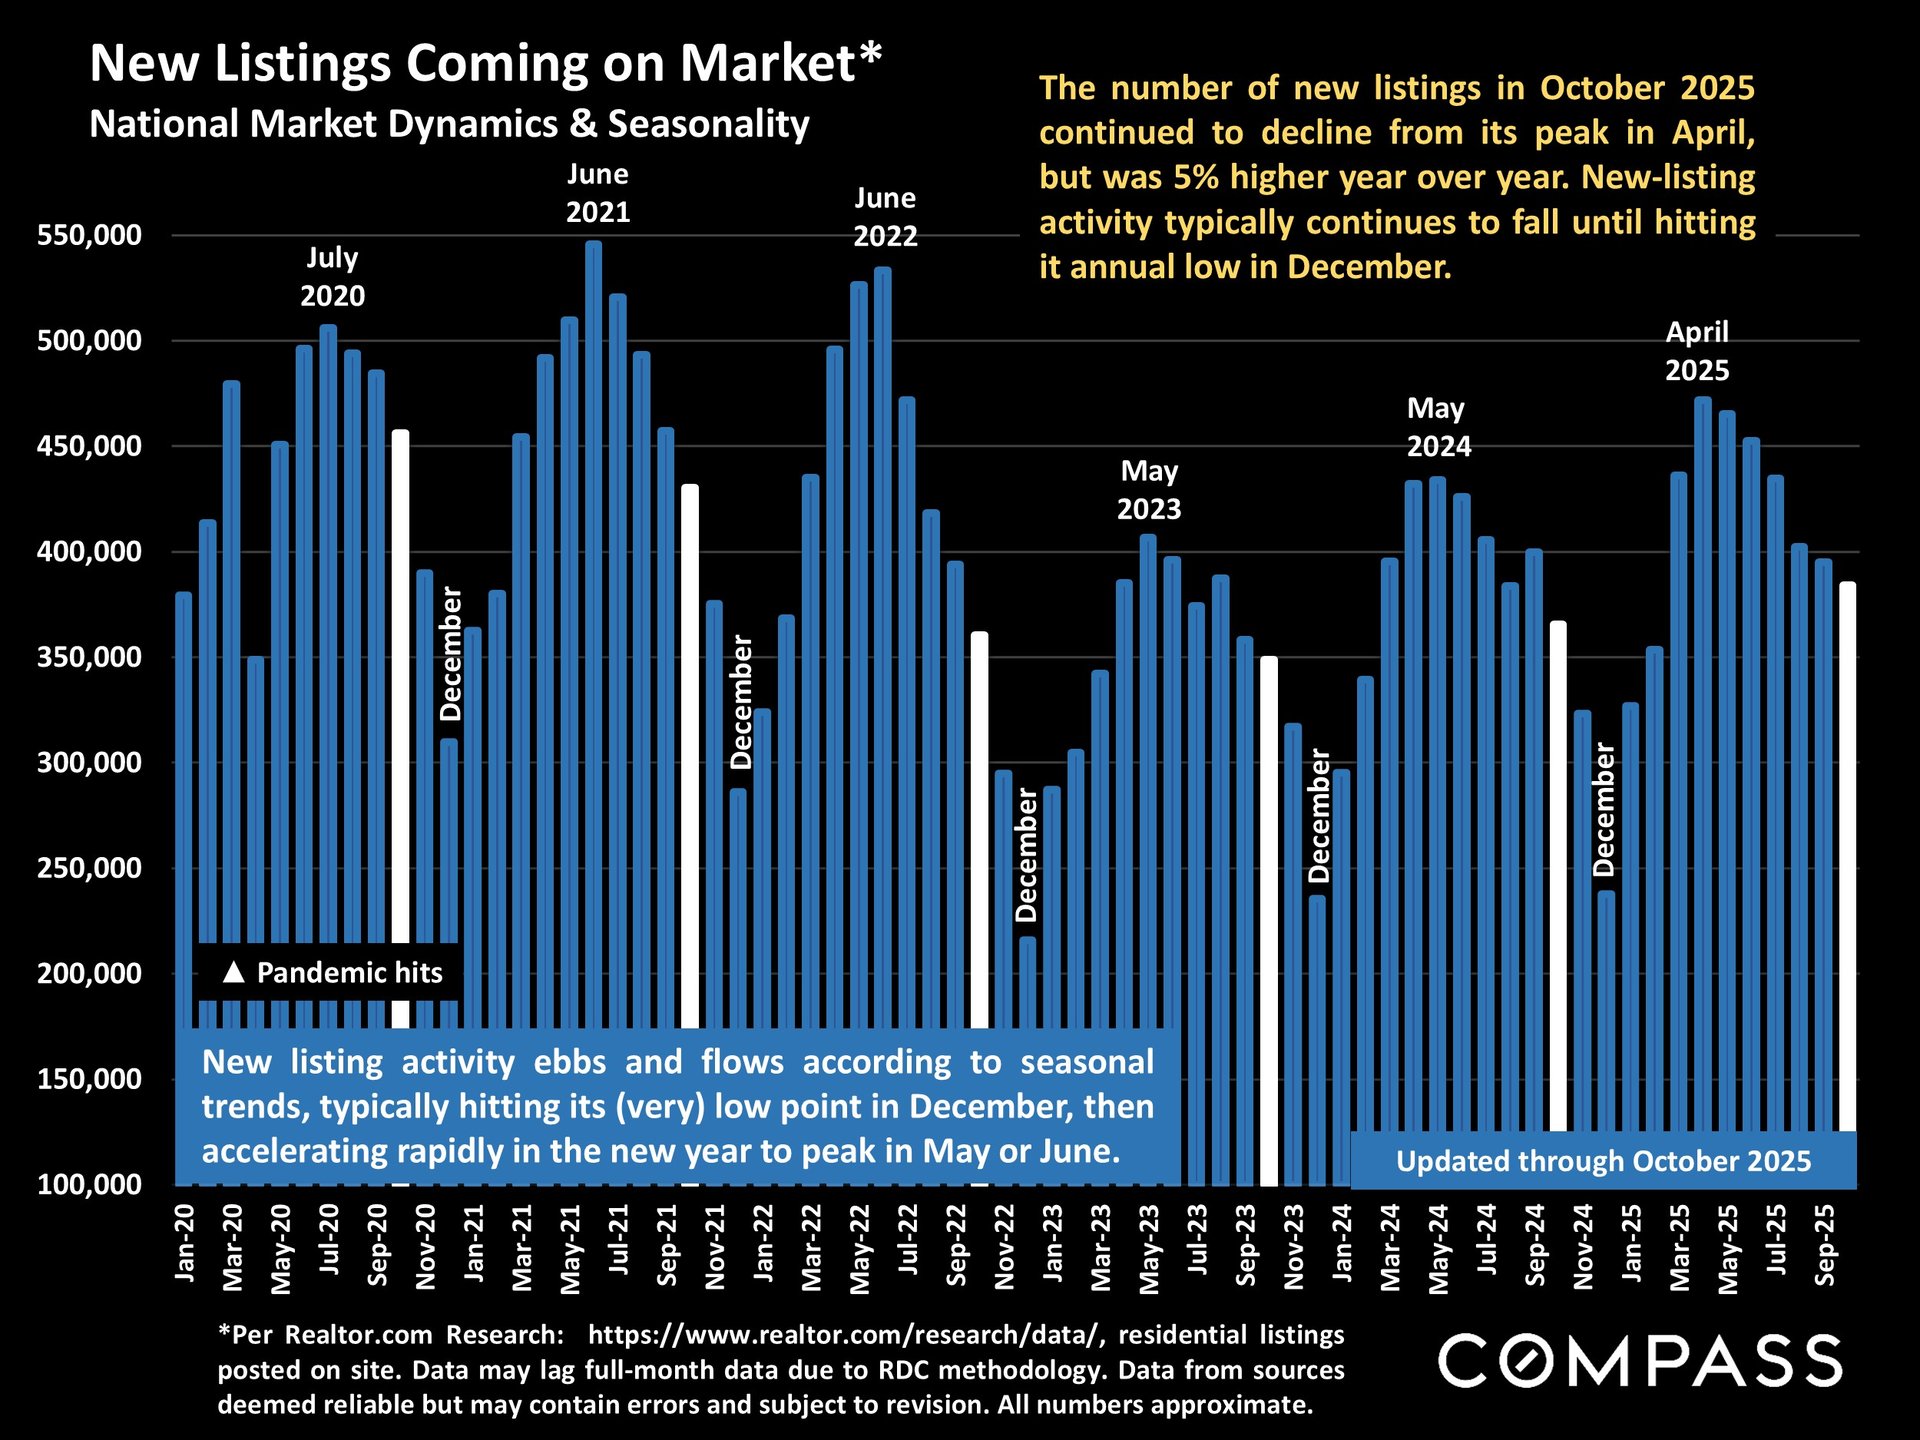
The number of new listings has been gradually falling from its normal peak in spring, but was 5% higher year over year. As can be seen, new listings usually plummet in December before beginning to climb again in the new year.
Monthly year-over-year increases in the number of active listings have been rapidly declining in recent months, but October 2025 still had an 11% increase over October 2024. Inventory is generally running at its highest level since 2020, but significantly lower than long-term norms.

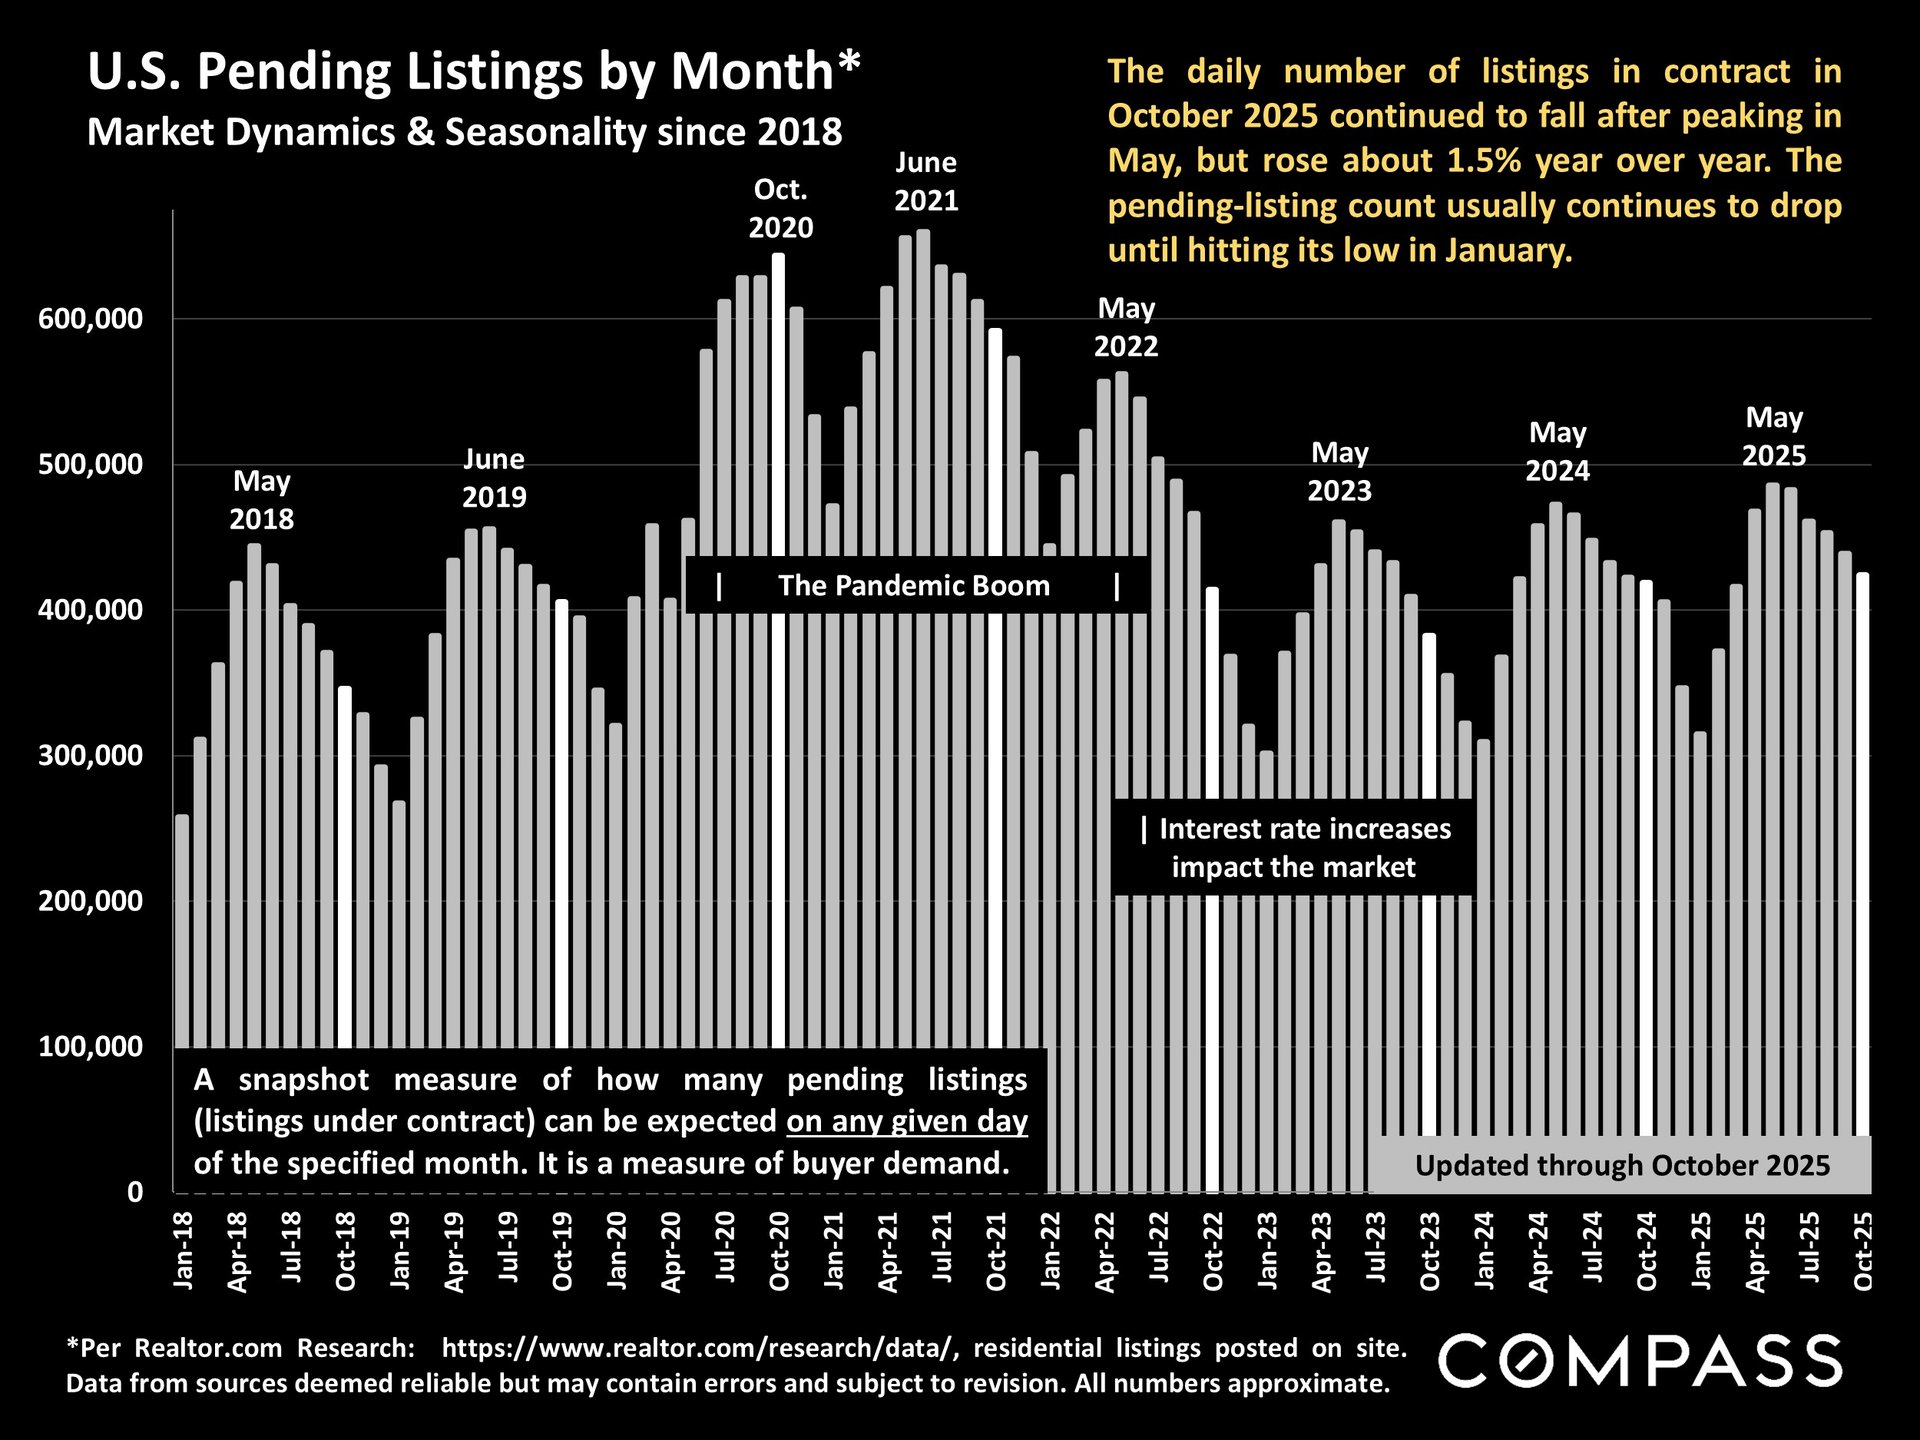
Pending-listing activity - reflecting listings accepting offers - typically peaks each year in spring and hits its low point in mid-winter. It was slightly higher in October on a year-over-year basis.
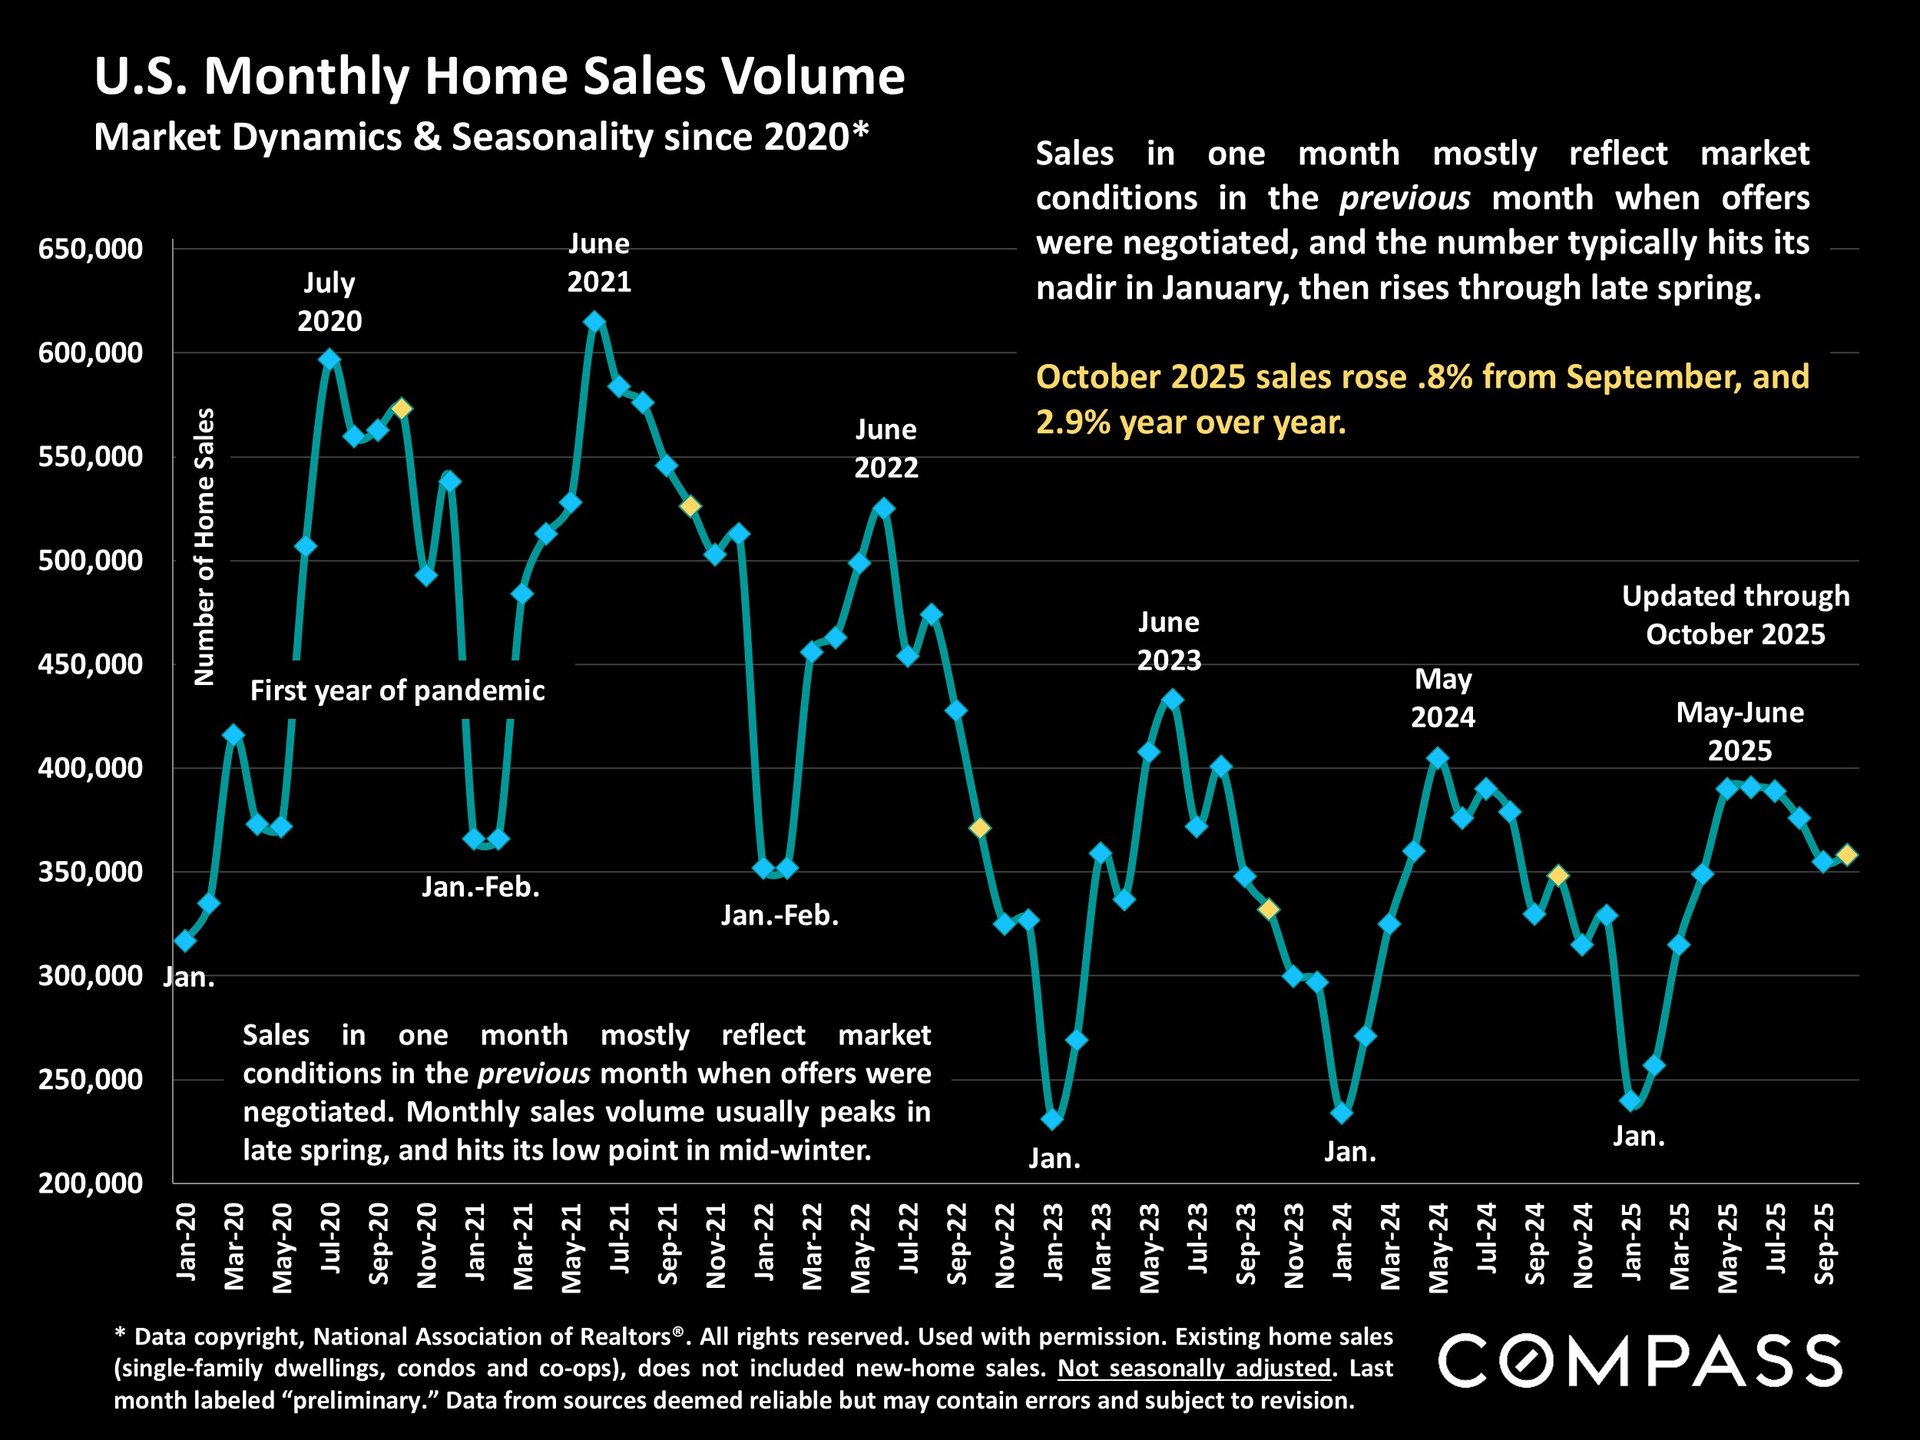
Sales ticked up from September and increased almost 3% from October 2024, but remained extremely low by long-term standards.
The number of price reductions in October rose 20%, but the percentage of active listings which reduced price during the month - illustrated below - barely rose from last year: With many more active listings, a similar percentage translated into a much higher number of reductions.

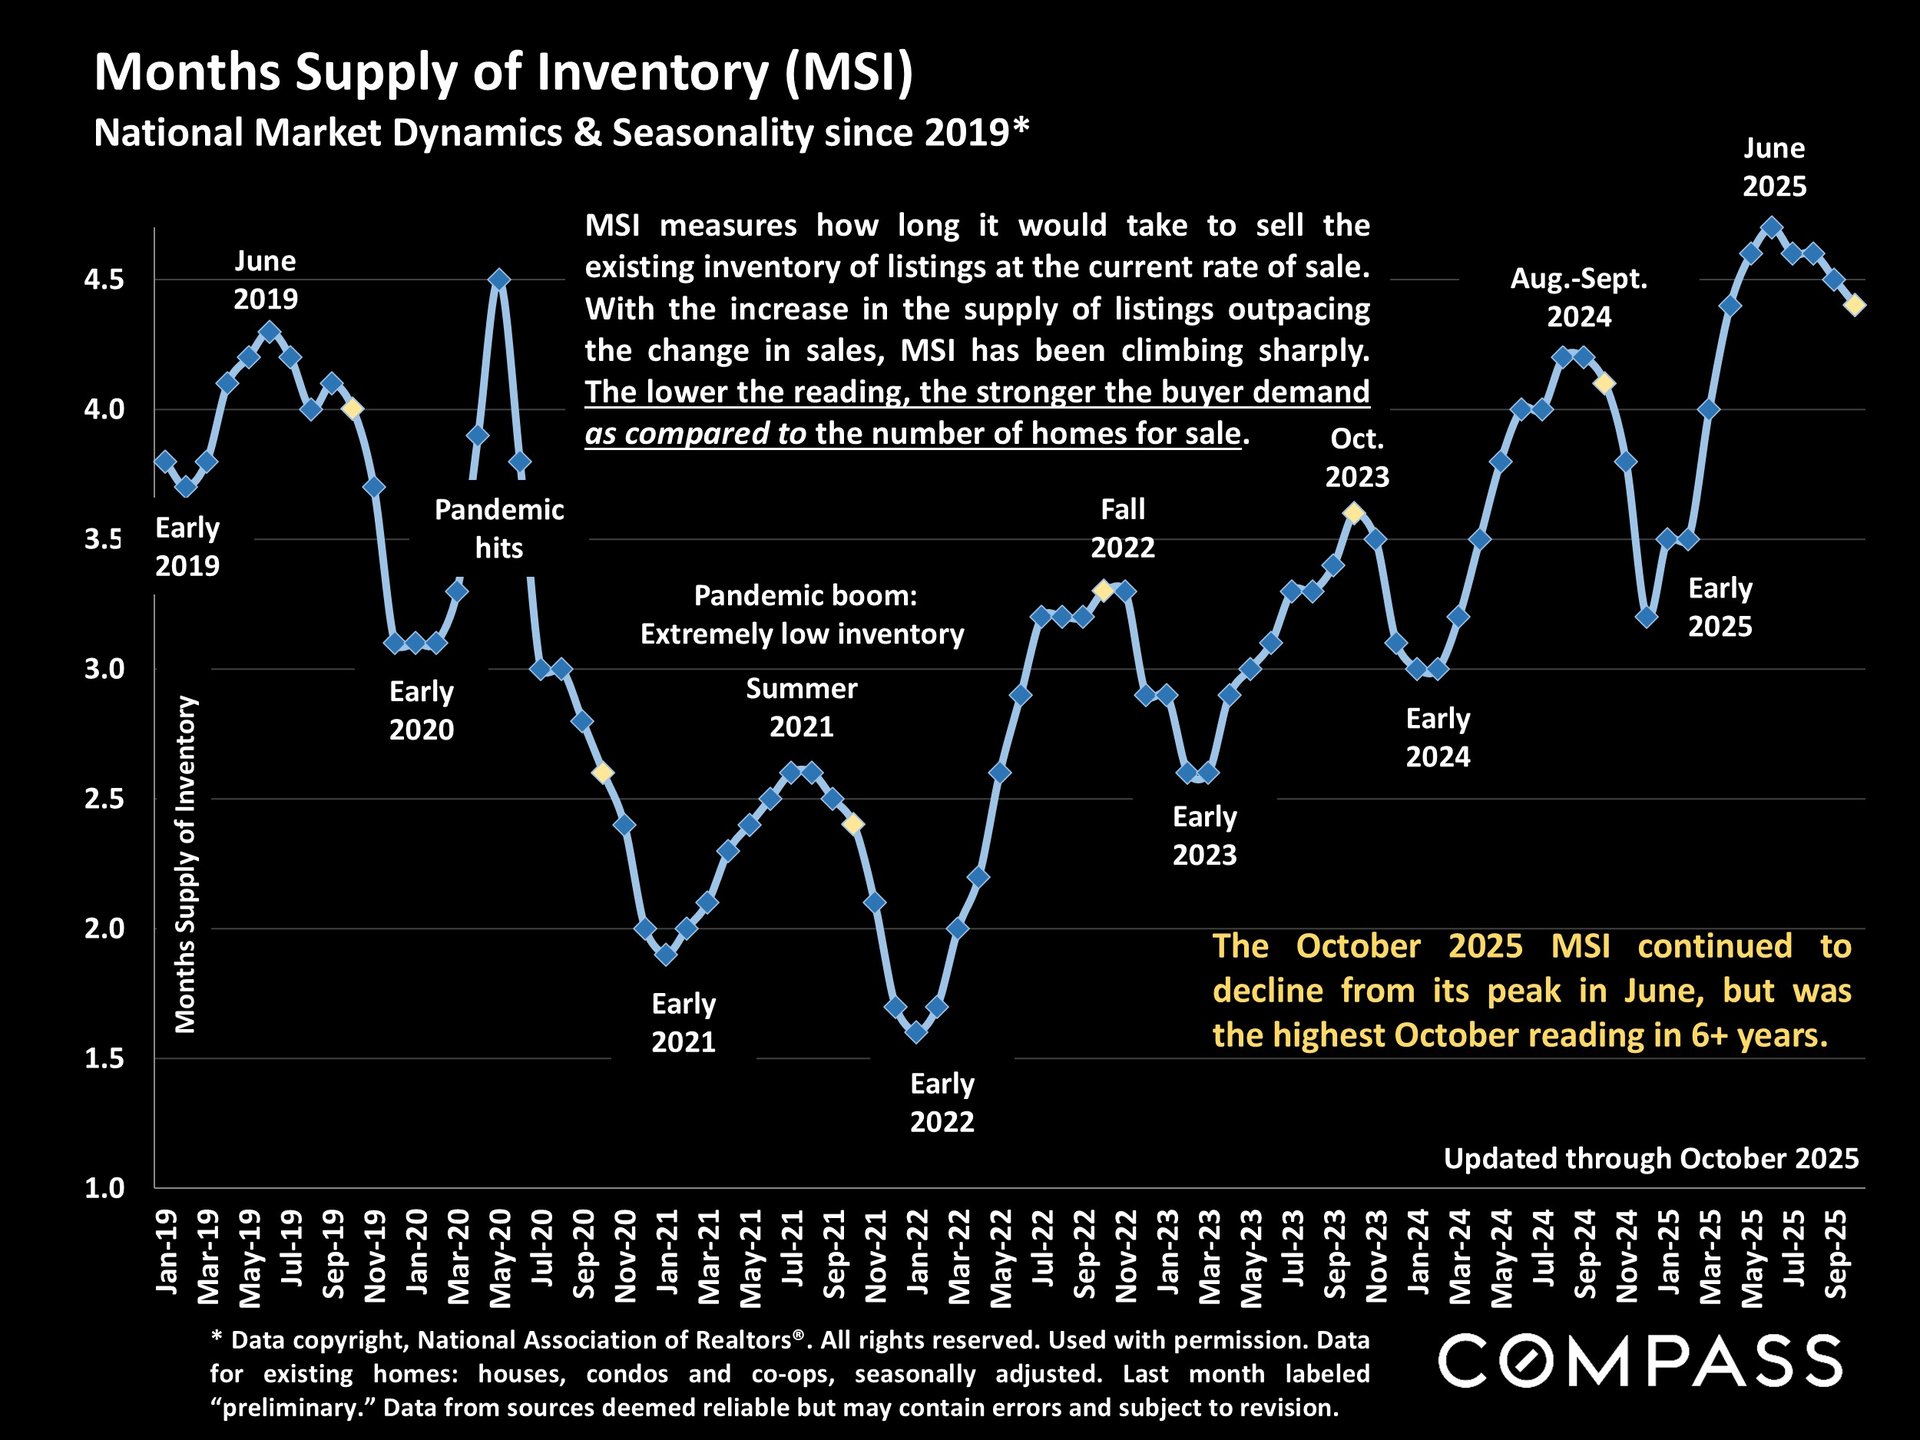
Months supply of inventory (MSI): The lower the reading, the higher the demand as compared to the supply of homes for sale. MSI has been falling since June due to increased demand, but running higher than last year due to the year-over-year increase in listings.
On this chart higher readings signify less affordability. Housing affordability remains a huge issue, but it has been improving with the decline in interest rates.
By longer-term standards, the national unemployment rate is not high, but it has been increasing. Employment and unemployment are 2 indicators the Fed takes very seriously while making decisions regarding its benchmark interest rate.

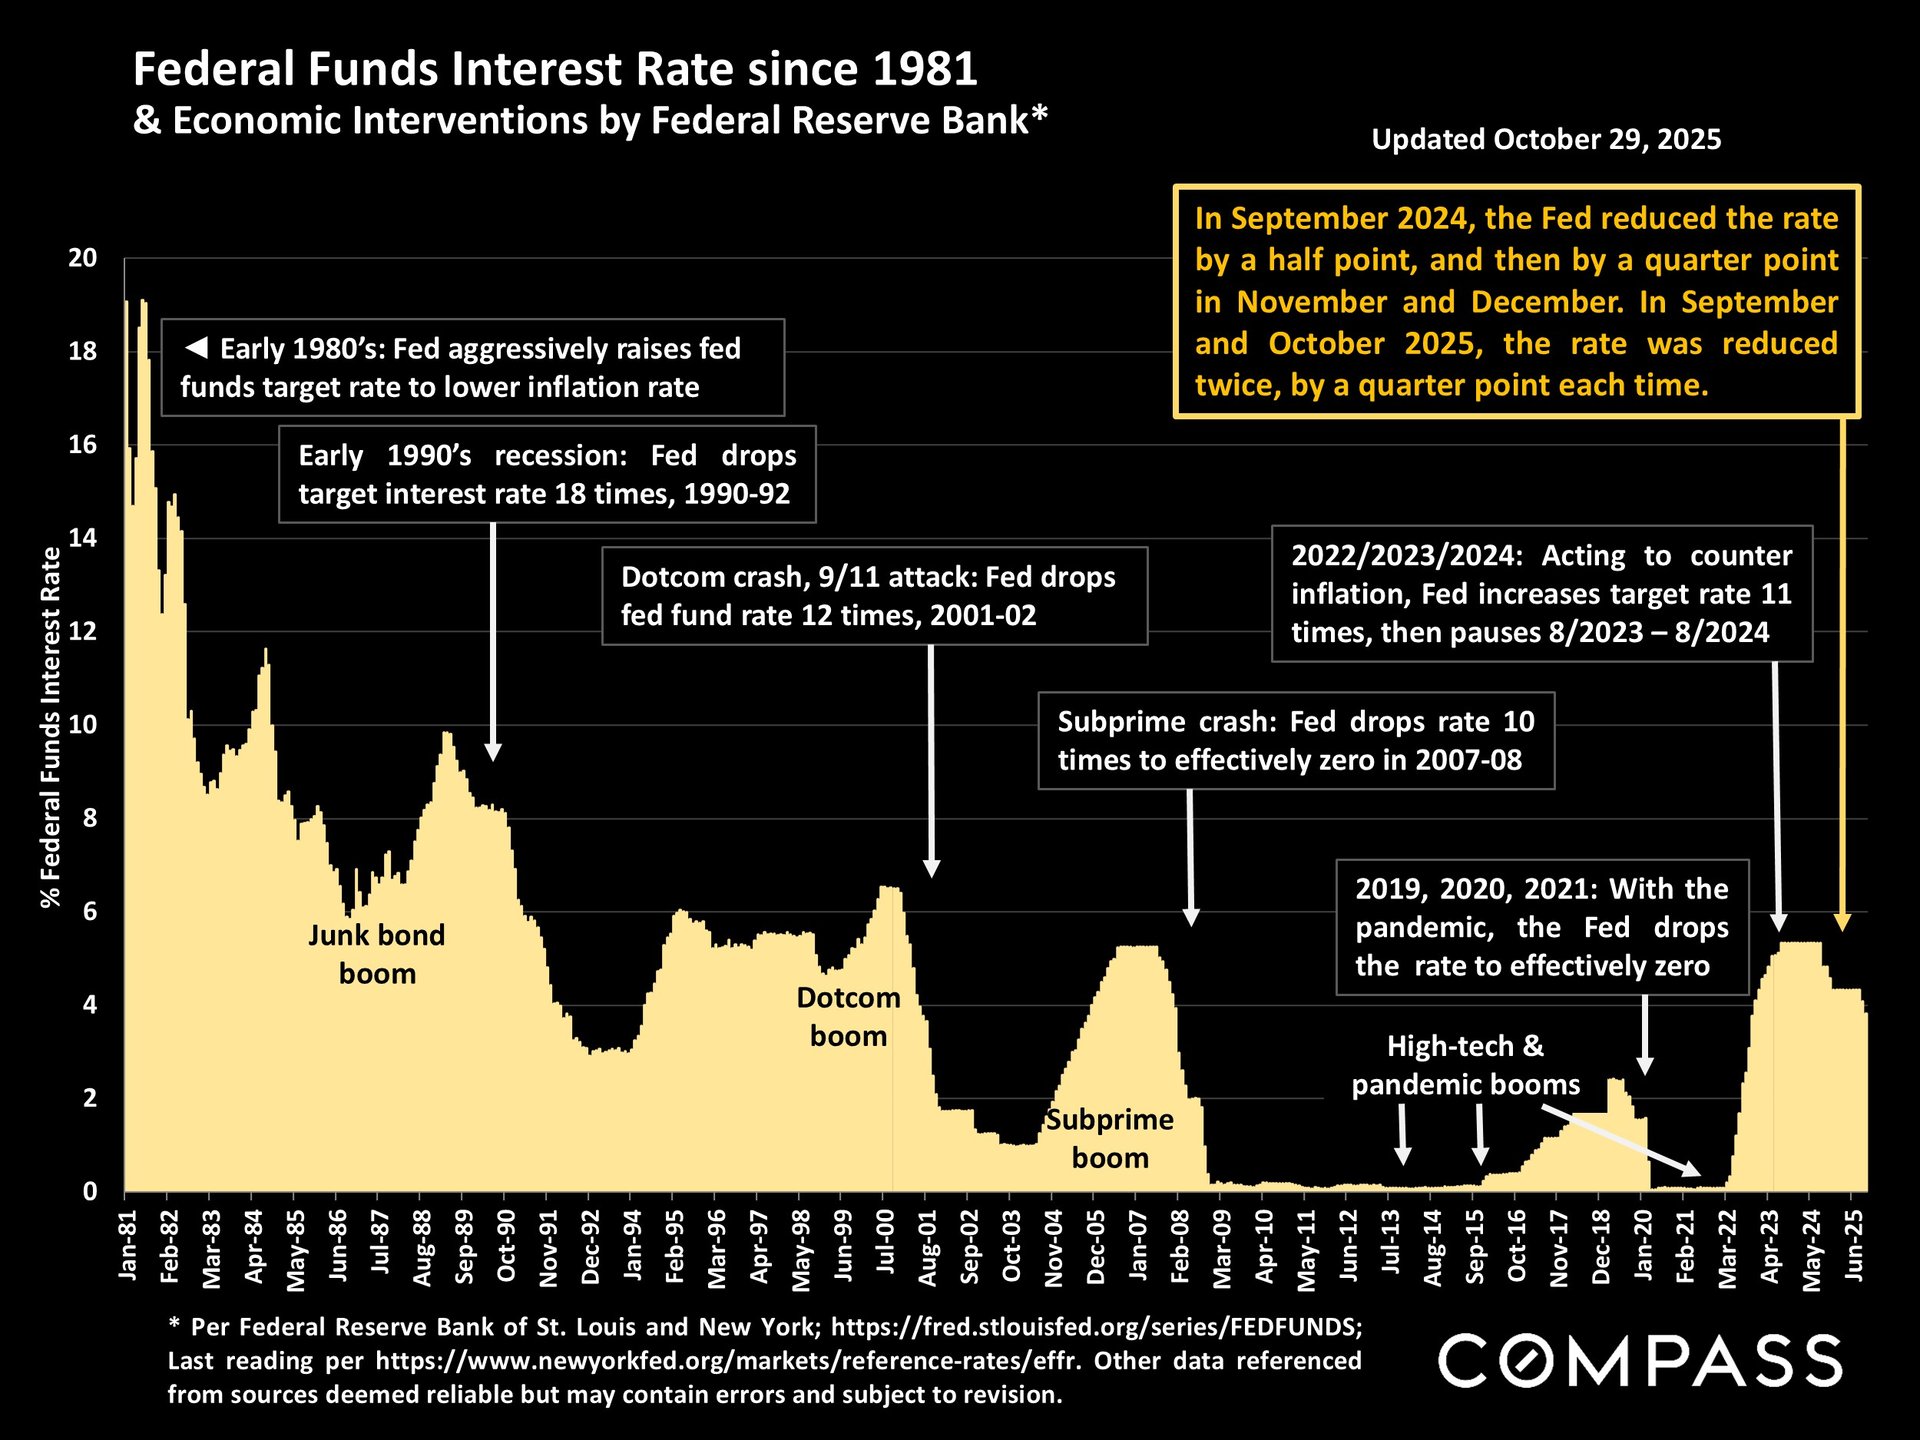
An illustration of all the benchmark-rate changes made by the Fed since 1981. Only 2 small rate reductions occurred so far in 2025, but there is a wide range of predictions as to what the Fed will do in December and 2026. Many economic and political factors are at play in the decision-making.